Fragility Module Verification
The question is that Does the GetProbability method of Fragility object correctly samples the defined distribution?. To find the answer of this question, first a Fragility object will be created. Then a range of manitude will be define and for each magnitude the result of the GetProbability method will be record and recorded results will be check by results of data created using Excel.
The below codes can be downloaded from here in Jupyter Notebook format. Also the Excel file that results are checked with, can be downloaded from here.
Verification1 for Normal Distribution:
#Import the software
import opensrane as opr

#Import Matplotlib package for plot purposes
import matplotlib.pyplot as plt

#Verification for normal distribution
opr.wipe()

obj=opr.Fragilities.Fragility(1,Distribution_Type='normal', mean=5, StdDev=2)
#Excel results for mean=5 and std=2
Excel=[0.00620966532577613,0.00714281073527141,0.00819753592459613,0.00938670553483857,0.0107241100216758,0.0122244726550447,0.0139034475134986,0.0157776073910905,0.0178644205628165,0.0201822154057044,0.0227501319481792,0.0255880595216386,0.0287165598160018,0.0321567747956137,0.0359303191129258,0.0400591568638171,0.044565462758543,0.0494714680336481,0.054799291699558,0.060570758002059,0.0668072012688581,0.0735292596096484,0.0807566592337711,0.088507991437402,0.0968004845856103,0.105649773666855,0.115069670221708,0.12507193563715,0.135666060946383,0.146859056375896,0.158655253931457,0.171056126308482,0.18406012534676,0.197662543122692,0.211855398583397,0.226627352376868,0.241963652223073,0.257846110805865,0.274253117750074,0.291159686788346,0.308537538725987,0.32635522028792,0.344578258389676,0.363169348824381,0.382088577811047,0.401293674317076,0.420740290560897,0.440382307629757,0.460172162722971,0.480061194161628,0.5,0.519938805838372,0.539827837277029,0.559617692370243,0.579259709439103,0.598706325682924,0.617911422188953,0.636830651175619,0.655421741610324,0.67364477971208,0.691462461274013,0.708840313211654,0.725746882249926,0.742153889194135,0.758036347776927,0.773372647623132,0.788144601416603,0.802337456877308,0.81593987465324,0.828943873691518,0.841344746068543,0.853140943624104,0.864333939053617,0.87492806436285,0.884930329778292,0.894350226333145,0.90319951541439,0.911492008562598,0.919243340766229,0.926470740390352,0.933192798731142,0.939429241997941,0.945200708300442,0.950528531966352,0.955434537241457,0.959940843136183,0.964069680887074,0.967843225204386,0.971283440183998,0.974411940478361,0.977249868051821,0.979817784594296,0.982135579437183,0.98422239260891,0.986096552486501,0.987775527344955,0.989275889978324,0.990613294465161,0.991802464075404,0.992857189264729,0.993790334674224]

#Excel range of the Random Variable
Magnitude=[i/10 for i in range(101)]

#List of generated values by Created Object (obj)
Generated=[obj.GetProbability(i) for i in Magnitude]

plt.figure()
plt.plot(Magnitude,Excel,label='Excel')
plt.plot(Magnitude,Generated,label='Generated')
plt.legend()
plt.xlabel('Magnitude')
plt.ylabel('Probability')
plt.title(f'CDF Distribution for distribution={obj.DistType} mean={obj.mean} and std={obj.StdDev}',color='g')
plt.show()
The result of above code has been shown on the following image:
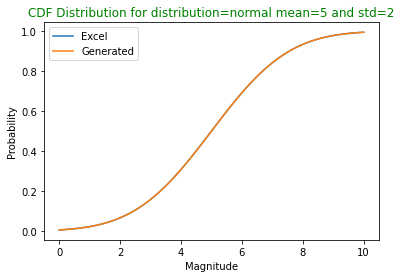
Comparision of results and defined curve in Excel
Verification2 for LogNormal Distribution:
#Import the software
import opensrane as opr

#Import Matplotlib package for plot purposes
import matplotlib.pyplot as plt

#Verification for lognormal distribution
opr.wipe()
import math
obj=opr.Fragilities.Fragility(1,Distribution_Type='lognormal', mean=1.8, StdDev=0.75)
#Excel results for mean=1.8 and std=0.75
Excel=[0.000443368872962805,0.00819753592459613,0.0314866575293163,0.0699982906412703,0.119342693644532,0.17484684050795,0.232802266520937,0.290608642066892,0.346582538307854,0.399715801925924,0.449469192643485,0.495616760008879,0.538134969498259,0.577126148320459,0.612766708635067,0.645272716115421,0.67487738964635,0.701816715355177,0.72632053093662,0.748607266593389,0.768881105912544,0.787330726979907,0.804129055749149,0.819433649162196,0.833387451949063,0.846119757123861,0.85774725873404,0.868375125142364,0.878098047981419,0.88700123998492,0.895161366949546,0.902647407020044,0.909521435626017,0.915839337628887,0.921651450179559,0.927003140865757,0.931935326234779,0.936484935912391,0.940685327438584,0.944566656698678,0.948156208506431,0.951478691535855,0.954556501427705,0.957409955532165,0.960057502401805,0.962515908824167,0.96480042688445,0.966924943276341,0.968902112832907,0.970743478028256,0.972459576002877,0.974060034489253,0.975553657857638,0.97694850436288,0.978251955550021,0.979470778667453,0.980611182840105,0.981678869669968,0.98267907885608,0.983616629359644]

#Excel range of the Random Variable
Magnitude=[i/2 for i in range(1,61)]

#List of generated values by Created Object (obj)
Generated=[obj.GetProbability(i) for i in Magnitude]

plt.figure()
plt.plot(Magnitude,Excel,label='Excel')
plt.plot(Magnitude,Generated,label='Generated')
plt.legend()
plt.xlabel('Magnitude')
plt.ylabel('Probability')
plt.title(f'CDF Dist-Type={obj.DistType} mean of Ln(x)={obj.mean} and std of Ln(x)={obj.StdDev}',color='g')
plt.show()
The result of above code has been shown on the following image:
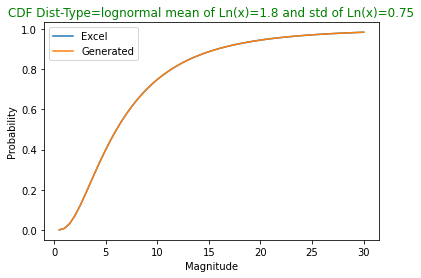
Comparision of results and defined curve in Excel
Verification by: Bijan Sayyafzadeh