Earthquake Module Verification
The question is that Does the SampleRandomMagnitude method of Earthquake object correctly samples the magnitudes?. To find the answer of this question, first a hazard object will be created. Then numerous samples will be created and record. Finally the distribution of recorded samples will be check by defined hazard object.
The below codes can be downloaded from here in Jupyter Notebook format.
Verification1:
#Import the software
import opensrane as opr

#Import Matplotlib package for plot purposes
import matplotlib.pyplot as plt

#Import random package
import random

#Clear Memory from probable created objects
opr.wipe()

#Create Hazard Object with tag=1 that is 0th Object
PGA=[1.4, 1.29984,1.27091,1.24865,1.22194,1.20191,1.17297,1.13959,1.11065,1.08172,
     1.05501,1.03275,0.994913,0.961526,0.92814,0.899205,0.872496,0.843561,0.816852,
     0.790143,0.761208,0.732273,0.696661,0.667727,0.636566,0.609857,0.589825,0.569793,
     0.549762,0.525278,0.503021,0.48744,0.469634,0.451828,0.431797,0.409539,0.38283,
     0.356121,0.338315,0.307154,0.280445,0.260413,0.23593,0.211447,0.17806,0.158029,
     0.142448,0.126868,0.113514,0.0979332,0.0845787,0.0712242,0.0578696,0.0534181,
     0.0489666,0.0445151,0.0356121,0.0356121,0.0311606]

Prob=[0, 0.000000446937,0.000000529832,0.000000607087,0.000000695608,0.000000824624,0.000000944864,
      0.00000115888,0.00000137382,0.00000157414,0.0000019307,0.00000206667,0.00000262252,0.00000321654,
      0.00000381312,0.00000452035,0.00000535876,0.00000657255,0.00000779158,0.00000955643,0.0000113289,
      0.0000134301,0.0000176322,0.000021626,0.0000265244,0.0000325323,0.0000372759,0.0000441896,0.000050633,
      0.0000621017,0.0000711569,0.0000843545,0.0000966544,0.000110748,0.000131288,0.000155639,0.0001975,
      0.000259294,0.000318026,0.000403563,0.000548171,0.000744597,0.00104642,0.00152148,0.00253478,0.00356225,
      0.00467682,0.00657255,0.00892769,0.0109499,0.0143759,0.0209024,0.0274425,0.0325323,0.0399011,0.048939,
      0.060024,0.0687762,0.0843545]

obj=opr.Hazard.Earthquake(1,'PGA',PGA,Prob)

#Sampling and recording results
Freq=[0 for i in PGA]
N=1000
for i in range(N):

    Magnitude=opr.Hazard.ObjManager.Objlst[0].SampleRandomMagnitude()

    if Magnitude==0:
        continue

    for mag in PGA:

        if Magnitude>=mag:
            if Magnitude==mag:
                Freq[PGA.index(mag)] +=1
            else:
                Freq[PGA.index(mag)-1] +=1
            break

Freq=[i/N for i in Freq]
Freq=[sum(Freq[0:i]) for i in range(len(Freq))]


#Plot Results
plt.figure()
plt.plot(PGA,Prob,label='Original')
plt.plot(PGA,Freq,label='Sampled');
plt.xlabel('PGA')
plt.ylabel('Probability of exceedance')
plt.legend()
The result of above code has been shown on the following image:
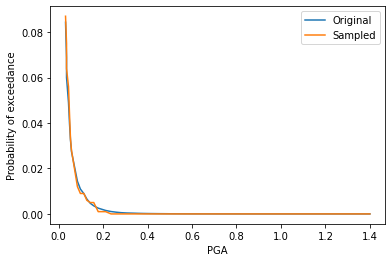
Numeric results of samples and defined hazard curve
Verification2:
#Import the software
import opensrane as opr

#Import Matplotlib package for plot purposes
import matplotlib.pyplot as plt

#Import random package
import random

#Clear Memory from probable created objects
opr.wipe()

#Create Hazard Object with tag=1 that is 0th Object
PGA=[i*5/100 for i in range(1,61)]

Prob=[0.0004*i**(-1.82) for i in PGA]
Prob[-1]=0

obj=opr.Hazard.Earthquake(1,'PGA',PGA,Prob)

#Sampling and recording results

Freq=[0 for i in PGA]
N=1000
for i in range(N):

    Magnitude=opr.Hazard.ObjManager.Objlst[0].SampleRandomMagnitude()

    if Magnitude==0:
        continue

    for mag in PGA[::-1]:

        if Magnitude>=mag:

            Freq[PGA.index(mag)] +=1
            break

M=N-sum(Freq)
Freq=[i/N for i in Freq]
Freq=[(1-M/N)-sum(Freq[0:i]) for i in range(len(Freq))]

#Plot The results
    plt.figure()
plt.plot(PGA,Prob,label='Original')
plt.plot(PGA,Freq,label='Sampled');
plt.xlabel('PGA')
plt.ylabel('Probability of exceedance')
plt.legend()
The result of above code has been shown on the following image:
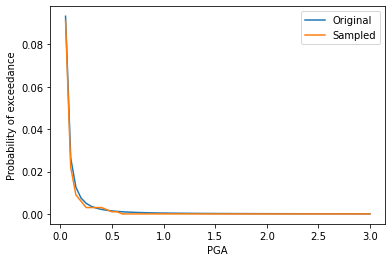
Numeric results of samples and defined hazard curve
Verification by: Bijan Sayyafzadeh